Week 34: Graphs and Data
Graphs and data: children collect, count and compare. Tally marks are introduced as a quick way to keep count.
What your child is practicing
- Counting and graphing
- Reading which group has the most
- Using tally marks
This week's worksheets
- Thinking Skills
- ~12 min
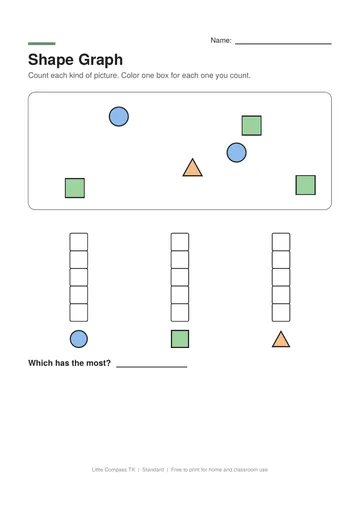
Shape Graph
Count each kind of shape and color a bar graph.
- Thinking Skills
- ~12 min
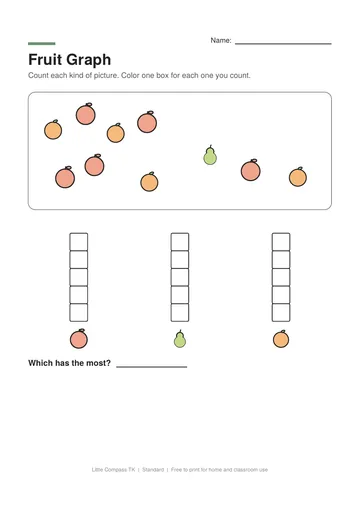
Fruit Graph
Count the fruit and color a bar graph.
- Thinking Skills
- ~12 min
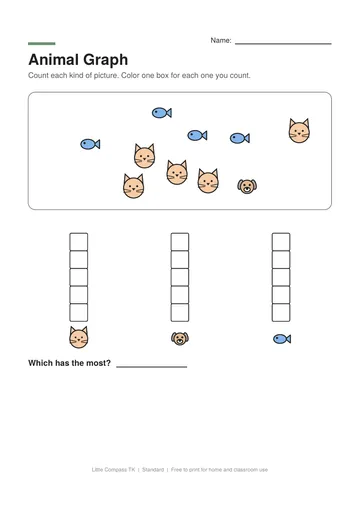
Animal Graph
Count the animals and color a bar graph.
- Early Math
- ~10 min
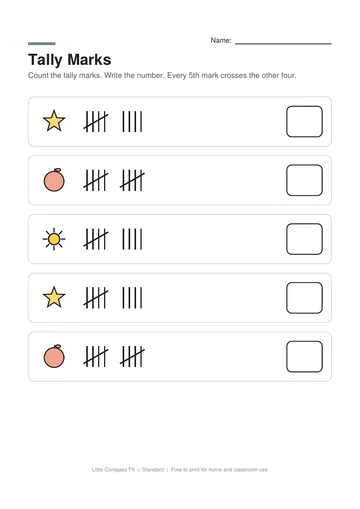
Tally Marks
Count the tally marks and write the number.
Try it off paper: Family survey
Ask everyone their favorite fruit and keep a tally. Who won?
Parent tip
Ask three questions: which has the most, which has the fewest, and are any the same?