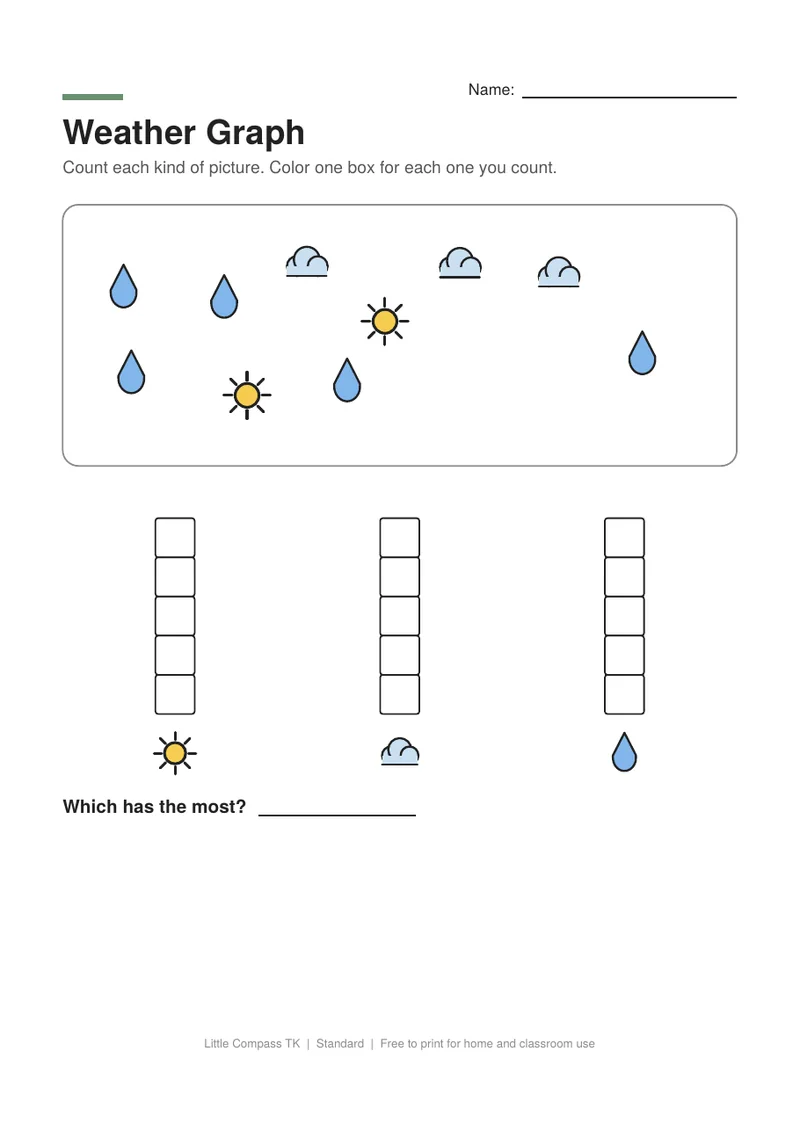
Weather Graph TK worksheet
- Ages 4-5
- About 12 minutes
- Thinking Skills
- You need: Crayons
A note for parents
Graphing turns counting into data. Coloring one box per picture builds the idea that a taller column means more.
How to help
- Count one kind of picture at a time and cross each off.
- Ask: "Which weather is most common where we live?"
- Track your own weather for a week on a calendar.
Choose "Actual size" or "100%" when printing. A4 is 210 x 297 mm; US Letter is 8.5 x 11 in. The black-and-white version uses less ink.
More from Week 15: Winter and Weather
- Letters & Writing
- ~8 min
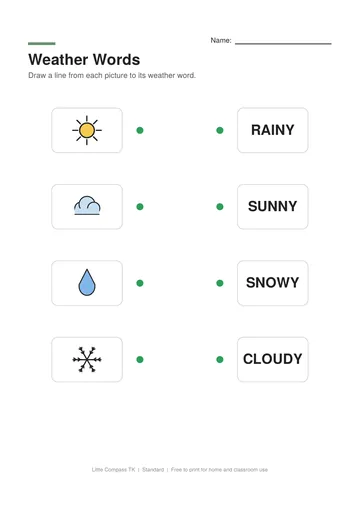
Weather Words
Match weather pictures to the words sunny, cloudy, rainy and snowy.
- Thinking Skills
- ~8 min
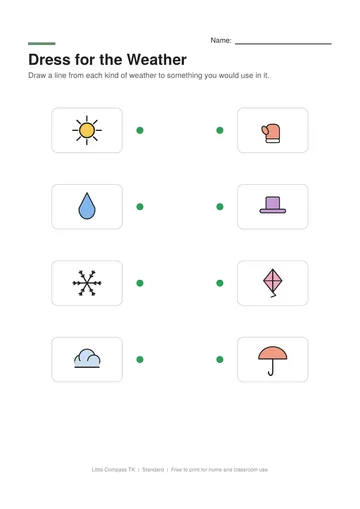
Dress for the Weather
Match weather to what you would wear or use: a sun hat, umbrella, mittens or a kite.
- Fine Motor
- ~8 min
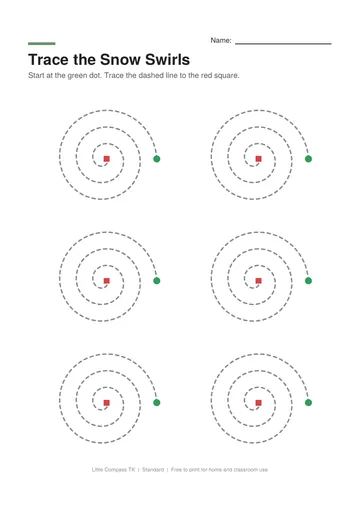
Trace the Snow Swirls
Trace spiral paths from the outside in, from the green dot to the red square.